Performance Benchmarks
This page presents performance benchmarks comparing QuaTorch against other quaternion libraries across different computational backends.
System Information
The benchmarks were performed on the following system:
CPU: 13th Gen Intel(R) Core(TM) i7-13700H (20 cores)
RAM: 16 GB
GPU: NVIDIA GeForce RTX 4050 Laptop GPU (6141 MiB)
System: Linux 6.14.0-37-generic
Python: 3.13.3 (CPython)
Benchmark Methodology
The benchmarks compare the following implementations:
numpy-quaternion: Using the
numpy-quaternionpackagequaternionic: Using the
quaternioniclibrarycpu_eager: QuaTorch on CPU in eager mode
cpu_compiled: QuaTorch on CPU with
torch.compilecuda_eager: QuaTorch on CUDA in eager mode
cuda_compiled: QuaTorch on CUDA with
torch.compile
Each benchmark measures execution time across different input sizes to evaluate scaling behavior. The bars represent mean execution time, with whiskers showing the range between minimum and maximum measured times.
⚠️ Note on Fair Comparisons
These benchmarks should be interpreted with caution for several reasons:
Different Compute Devices: CPU-based methods (numpy, quaternionic, cpu_eager, cpu_compiled) run on the Intel i7-13700H processor, while CUDA methods run on the NVIDIA RTX 4050 GPU. These are fundamentally different architectures optimized for different workloads.
Compilation Benefits: The
torch.compileresults show the benefits of PyTorch’s JIT compilation, but this benefit is only realized after a warmup period. First-run performance may differ.Dependencies: The
numpy-quaternionlibrary has no dependencies.quaternionicdepends onnumbafor JIT compilation. QuaTorch’s performance depends on PyTorch’s optimizations and GPU acceleration.
Reproducing the Benchmarks
To reproduce these benchmarks on your own system:
1. Run the Benchmark Tests
# Run all benchmarks and save results to benchmark_output.json
uv run pytest test/benchmark/test_performance.py --benchmark-only
The benchmark results will be saved to benchmark_output.json in the project root.
2. Generate Plots
After running the benchmarks, generate the visualization plots:
# Run the plotting test
uv run python  test/benchmark/test_performance.py benchmark_output.json
The plots will be saved as PNG files in the project root directory.
Benchmark Results
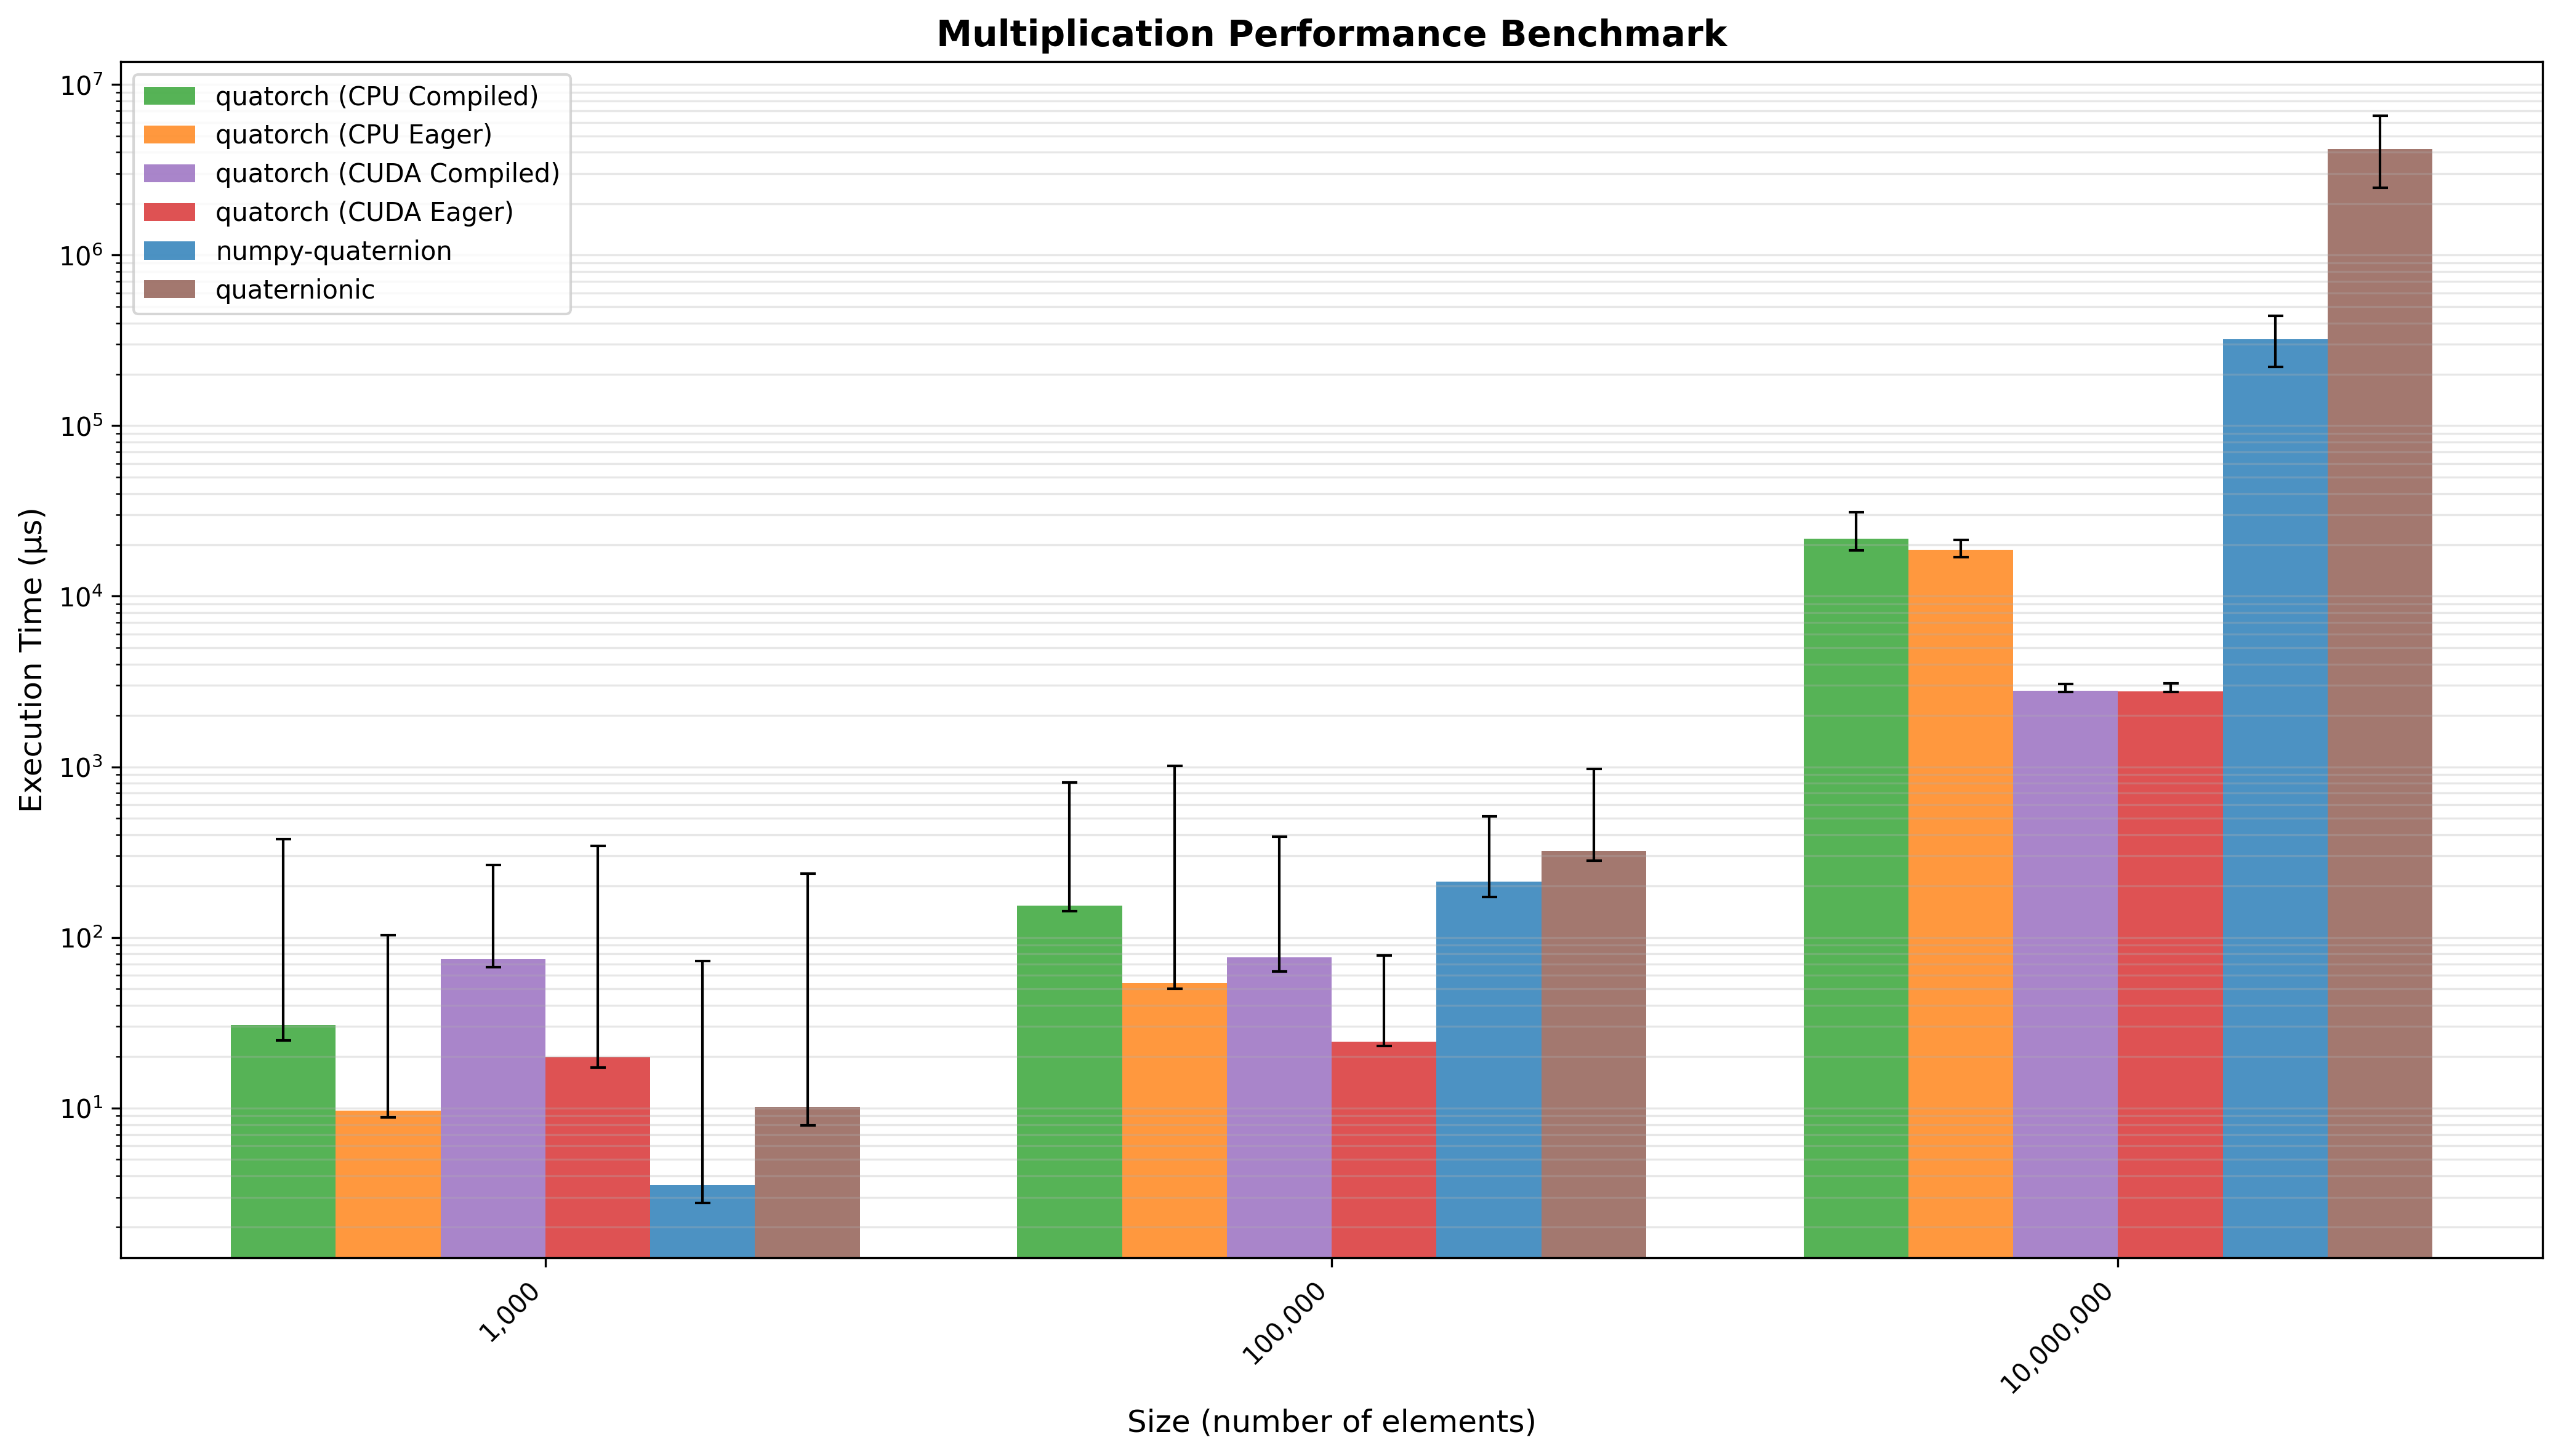
Quaternion Multiplication
Multiplication of two vectors of n quaternions. Quatorch (CPU Compiled) performed 1.33x faster than numpy-quaternion and 5.11x faster than quaternionic (geometric mean across all input sizes).
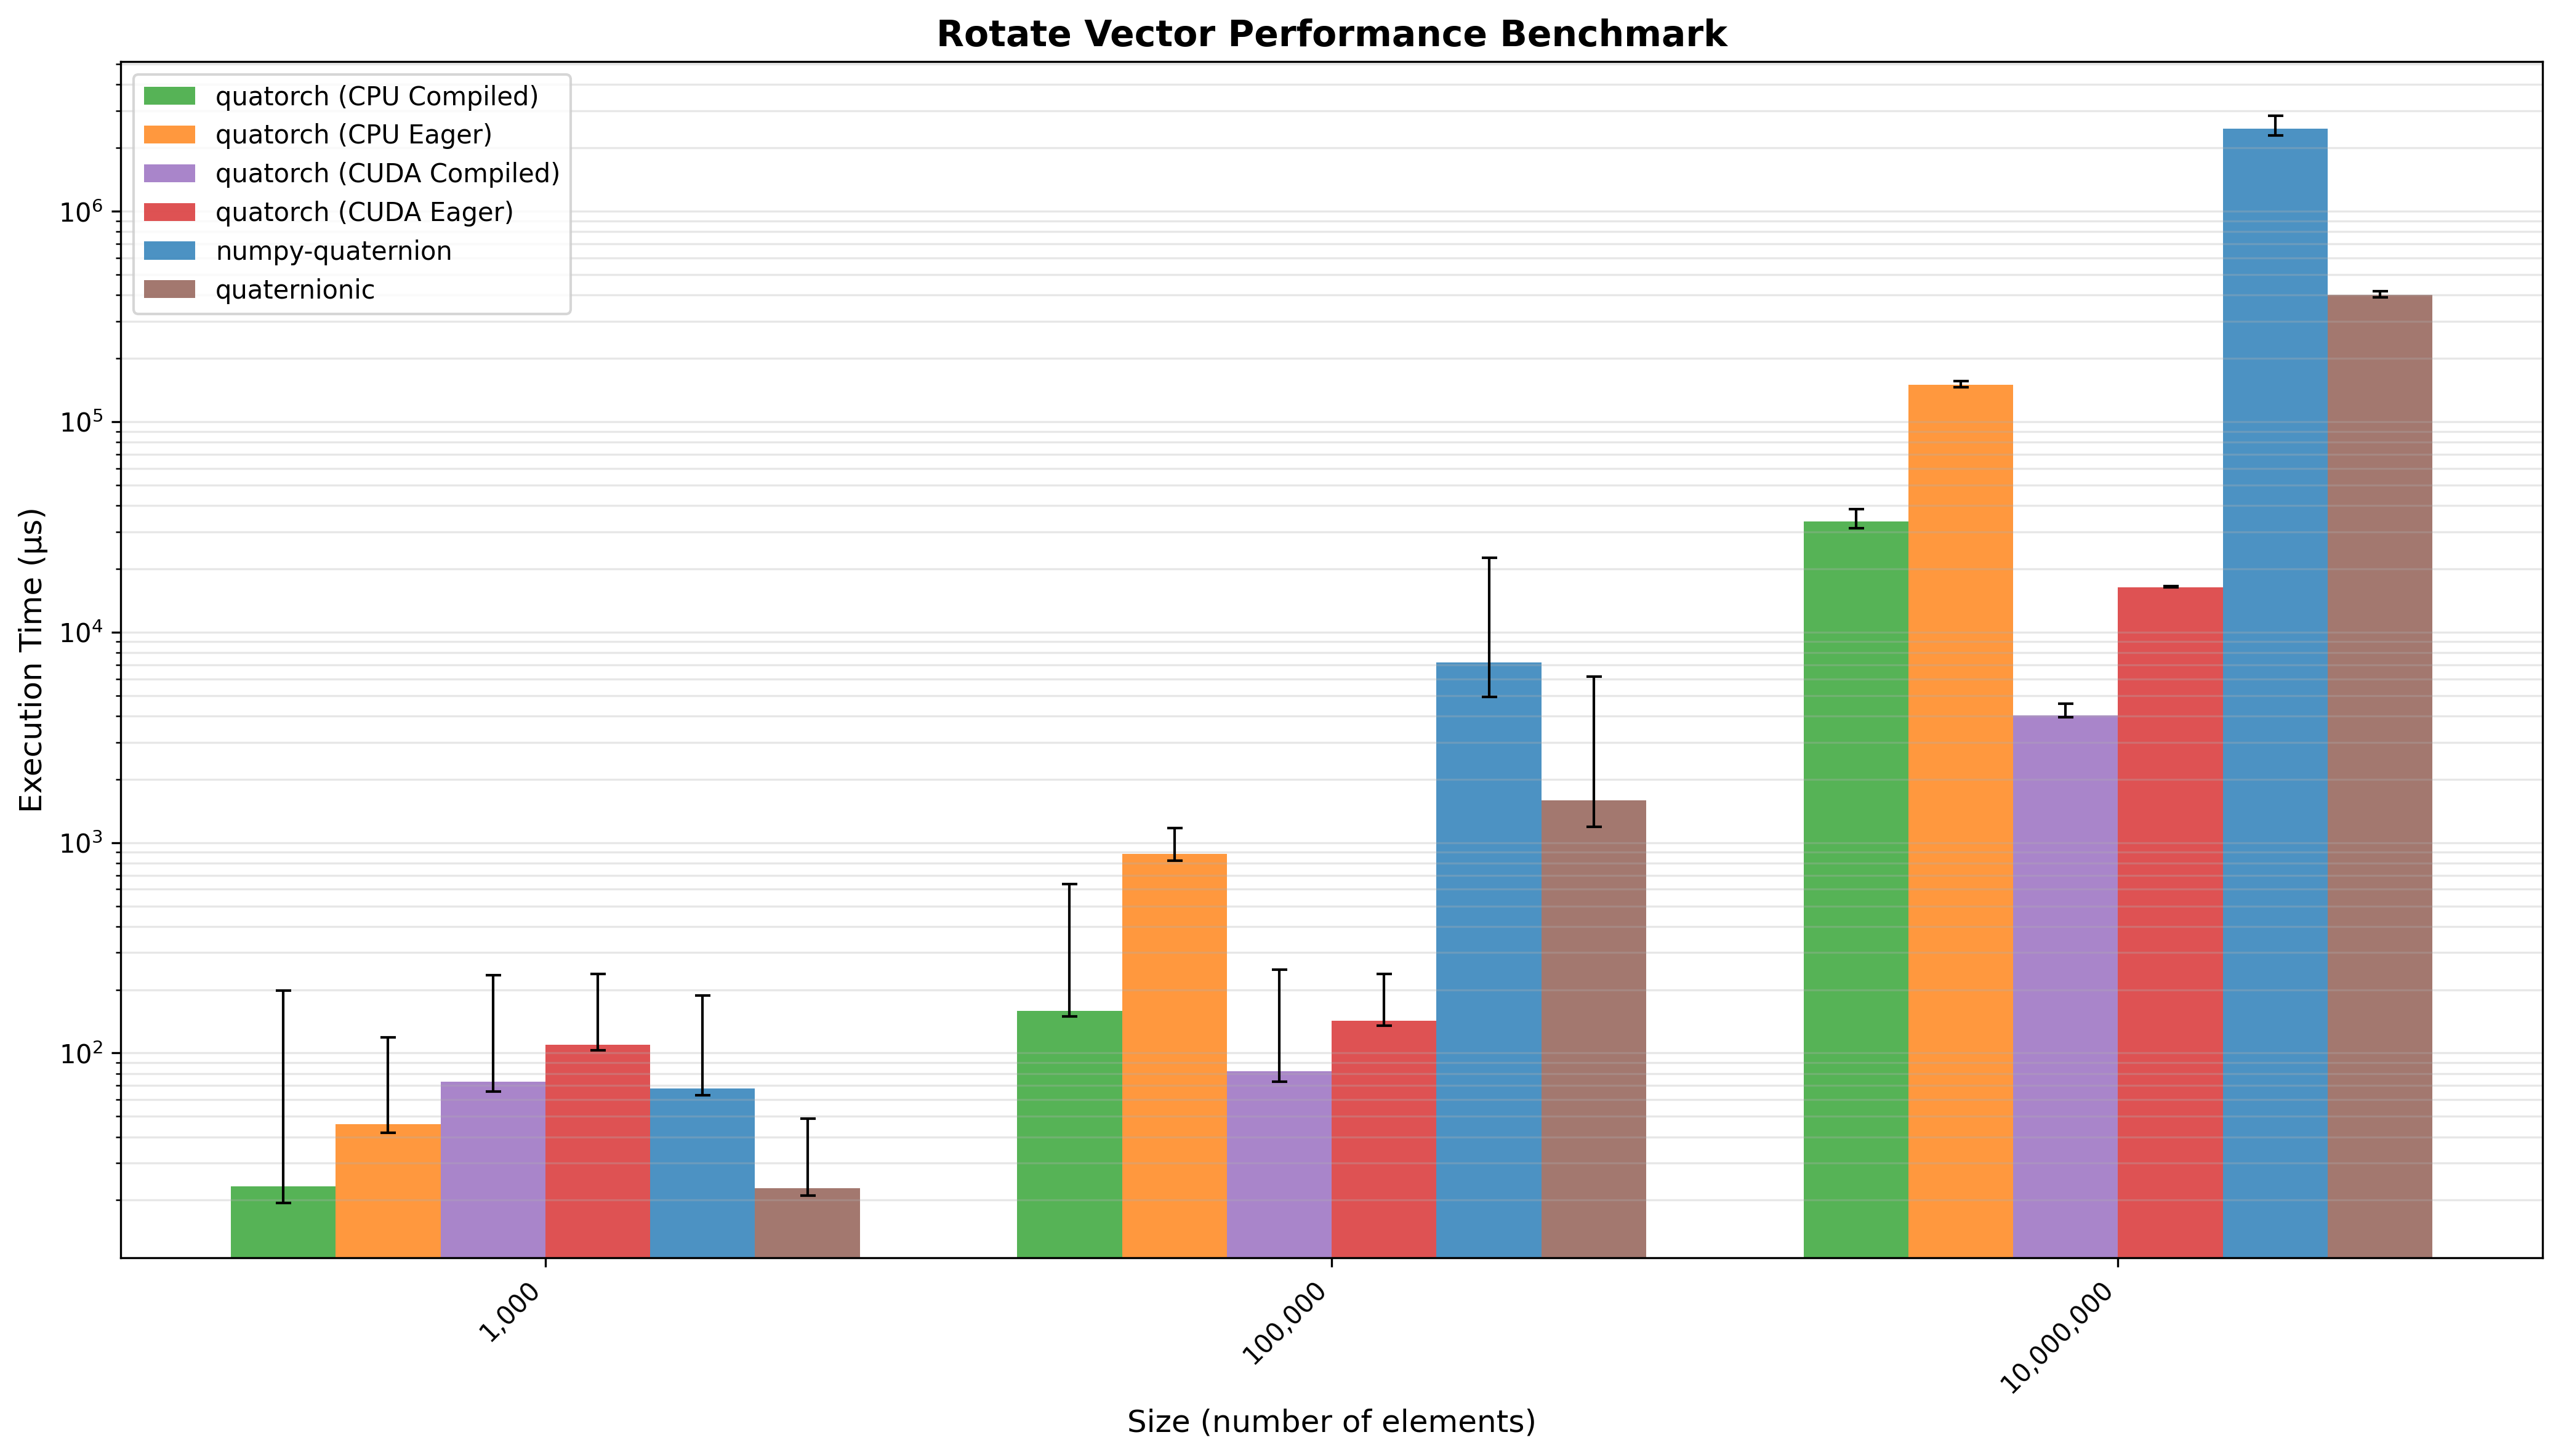
Vector Rotation
Rotation of a 3D vector by a vector of n quaternions. Quatorch (CPU Compiled) performed 21.32x faster than numpy-quaternion and 4.89x faster than quaternionic (geometric mean across all input sizes).
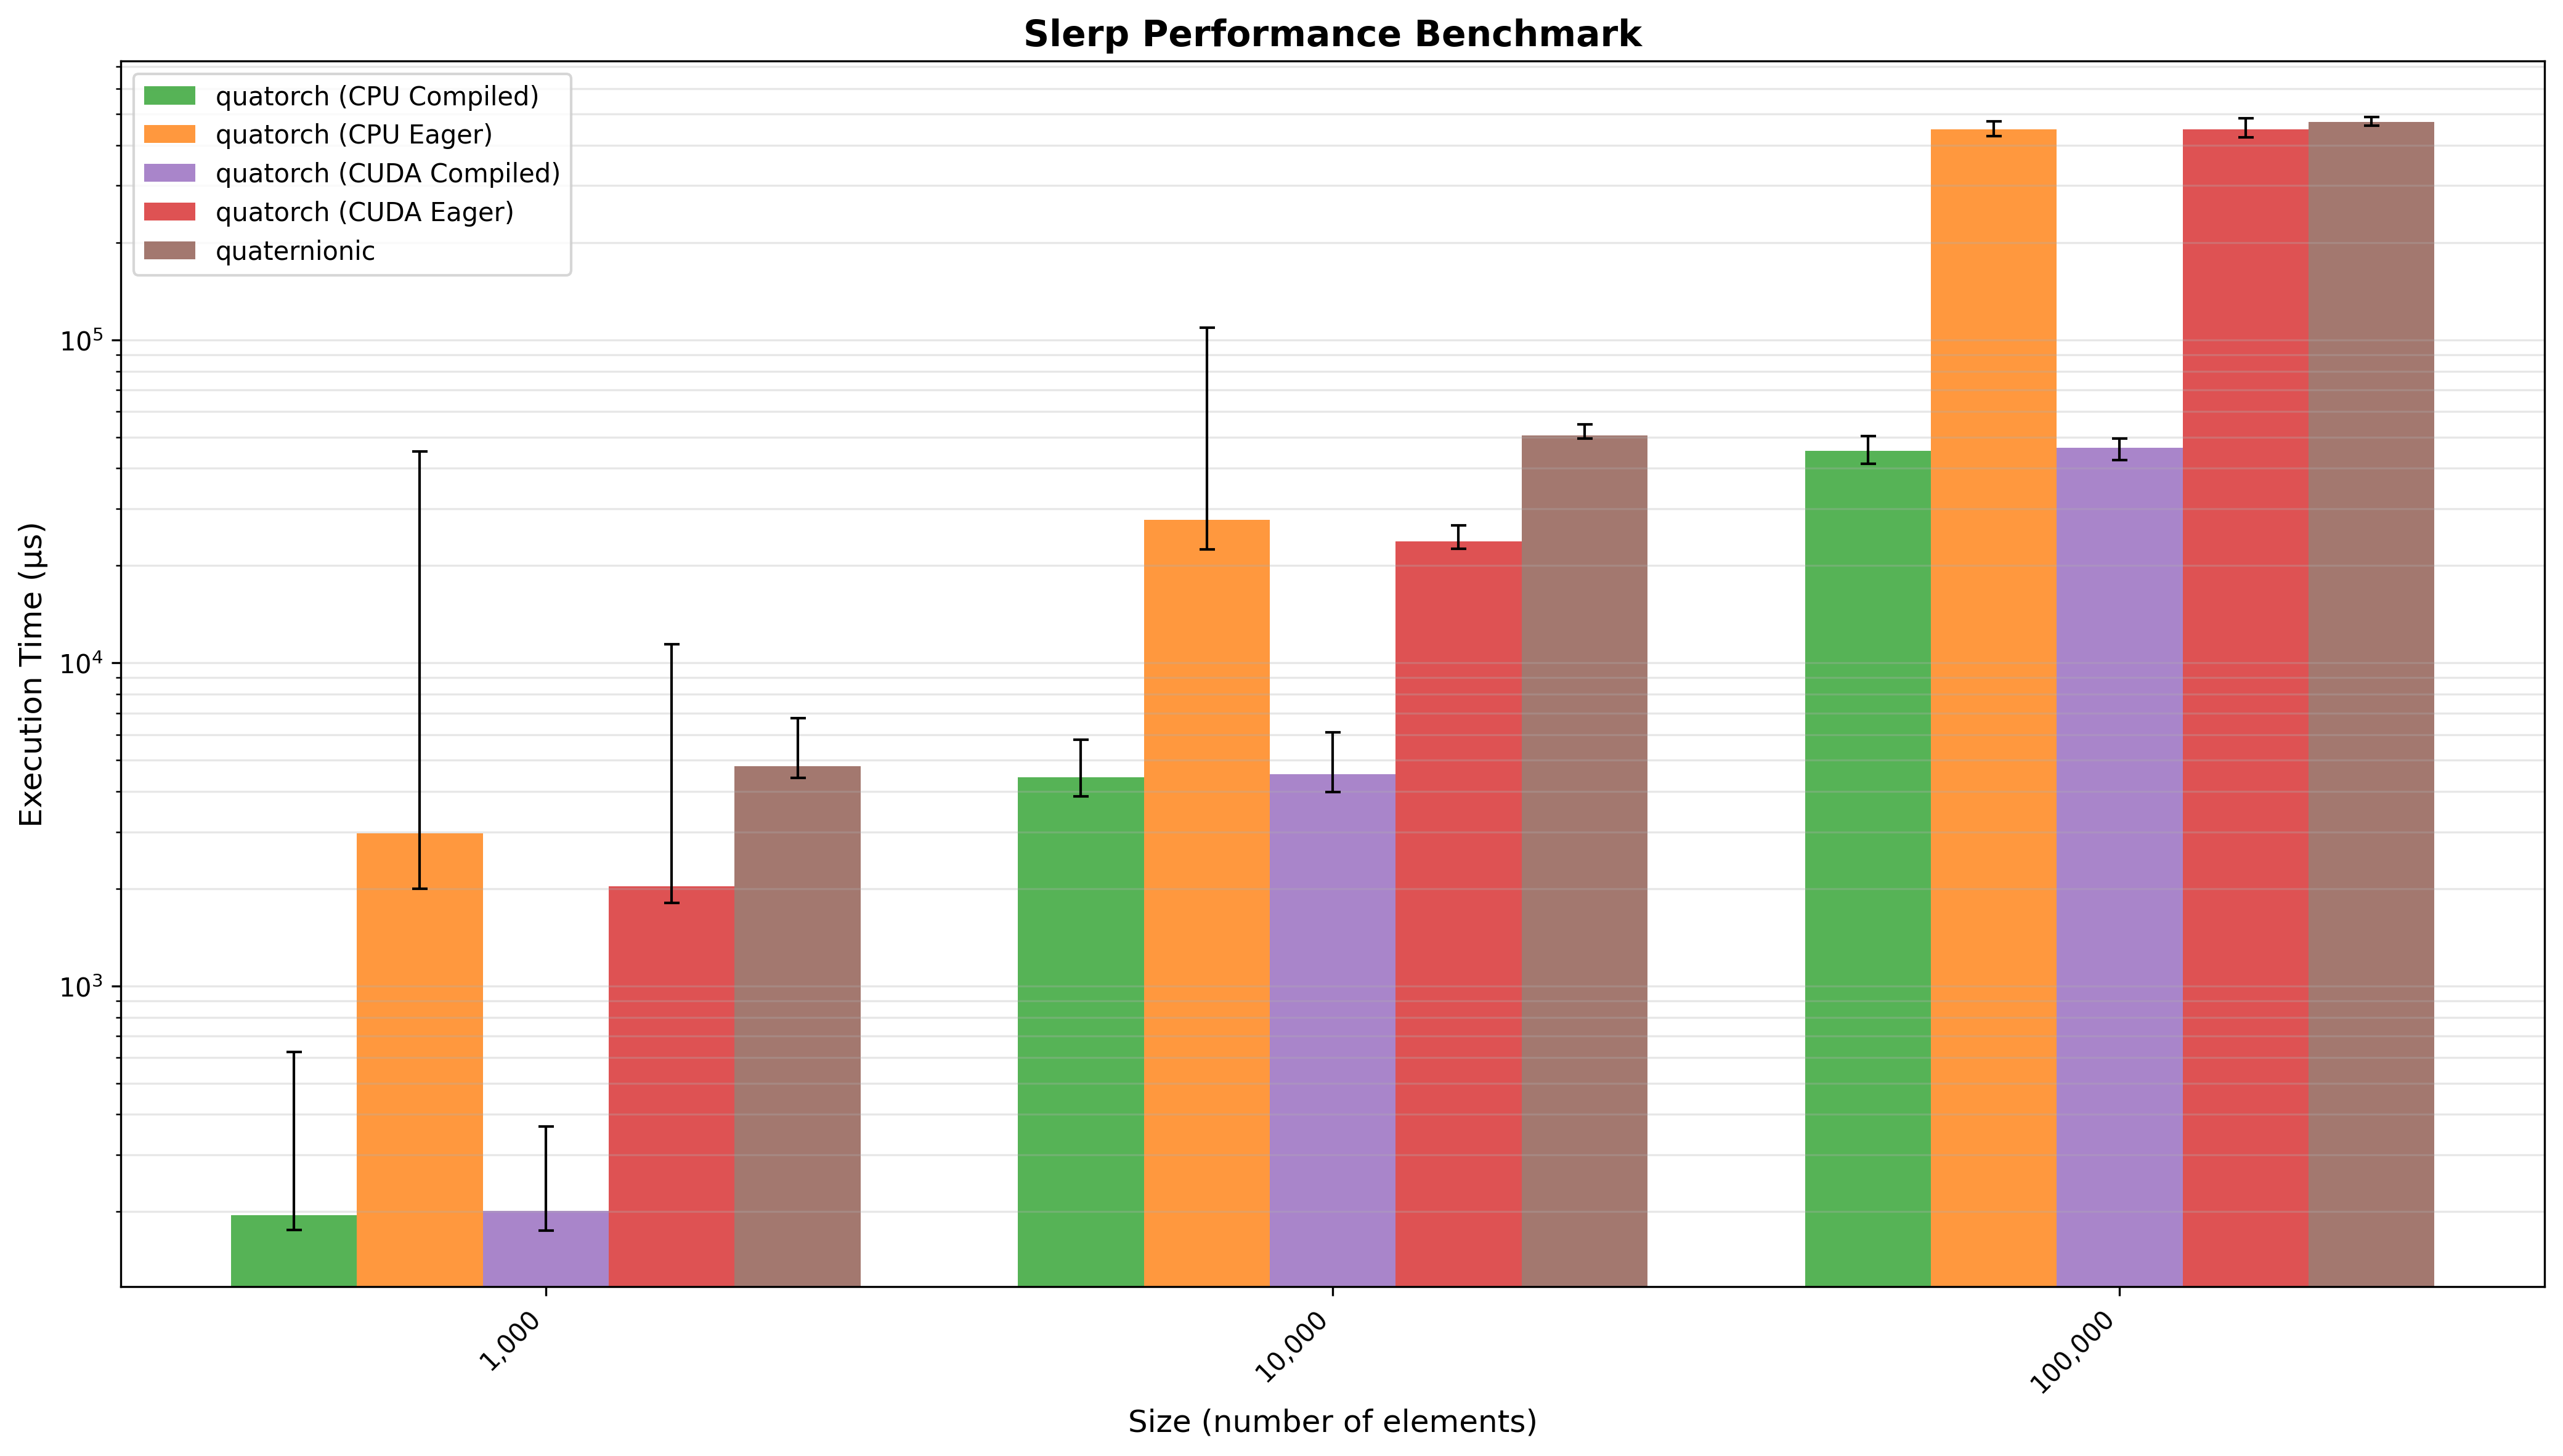
Spherical Linear Interpolation (SLERP)
SLERP interpolation between two vectors of n quaternions. Quatorch (CPU Compiled) performed 14.32x faster than quaternionic (geometric mean across all input sizes).